Joseph Ferdinando
- Visiting Lecturer
- Associate Director, Design Across Scales Lab
Department
Contact
Affiliations
Academic Research Areas
- Cities
- Digital media
- Installation art
- Technology and art
- Visual representation
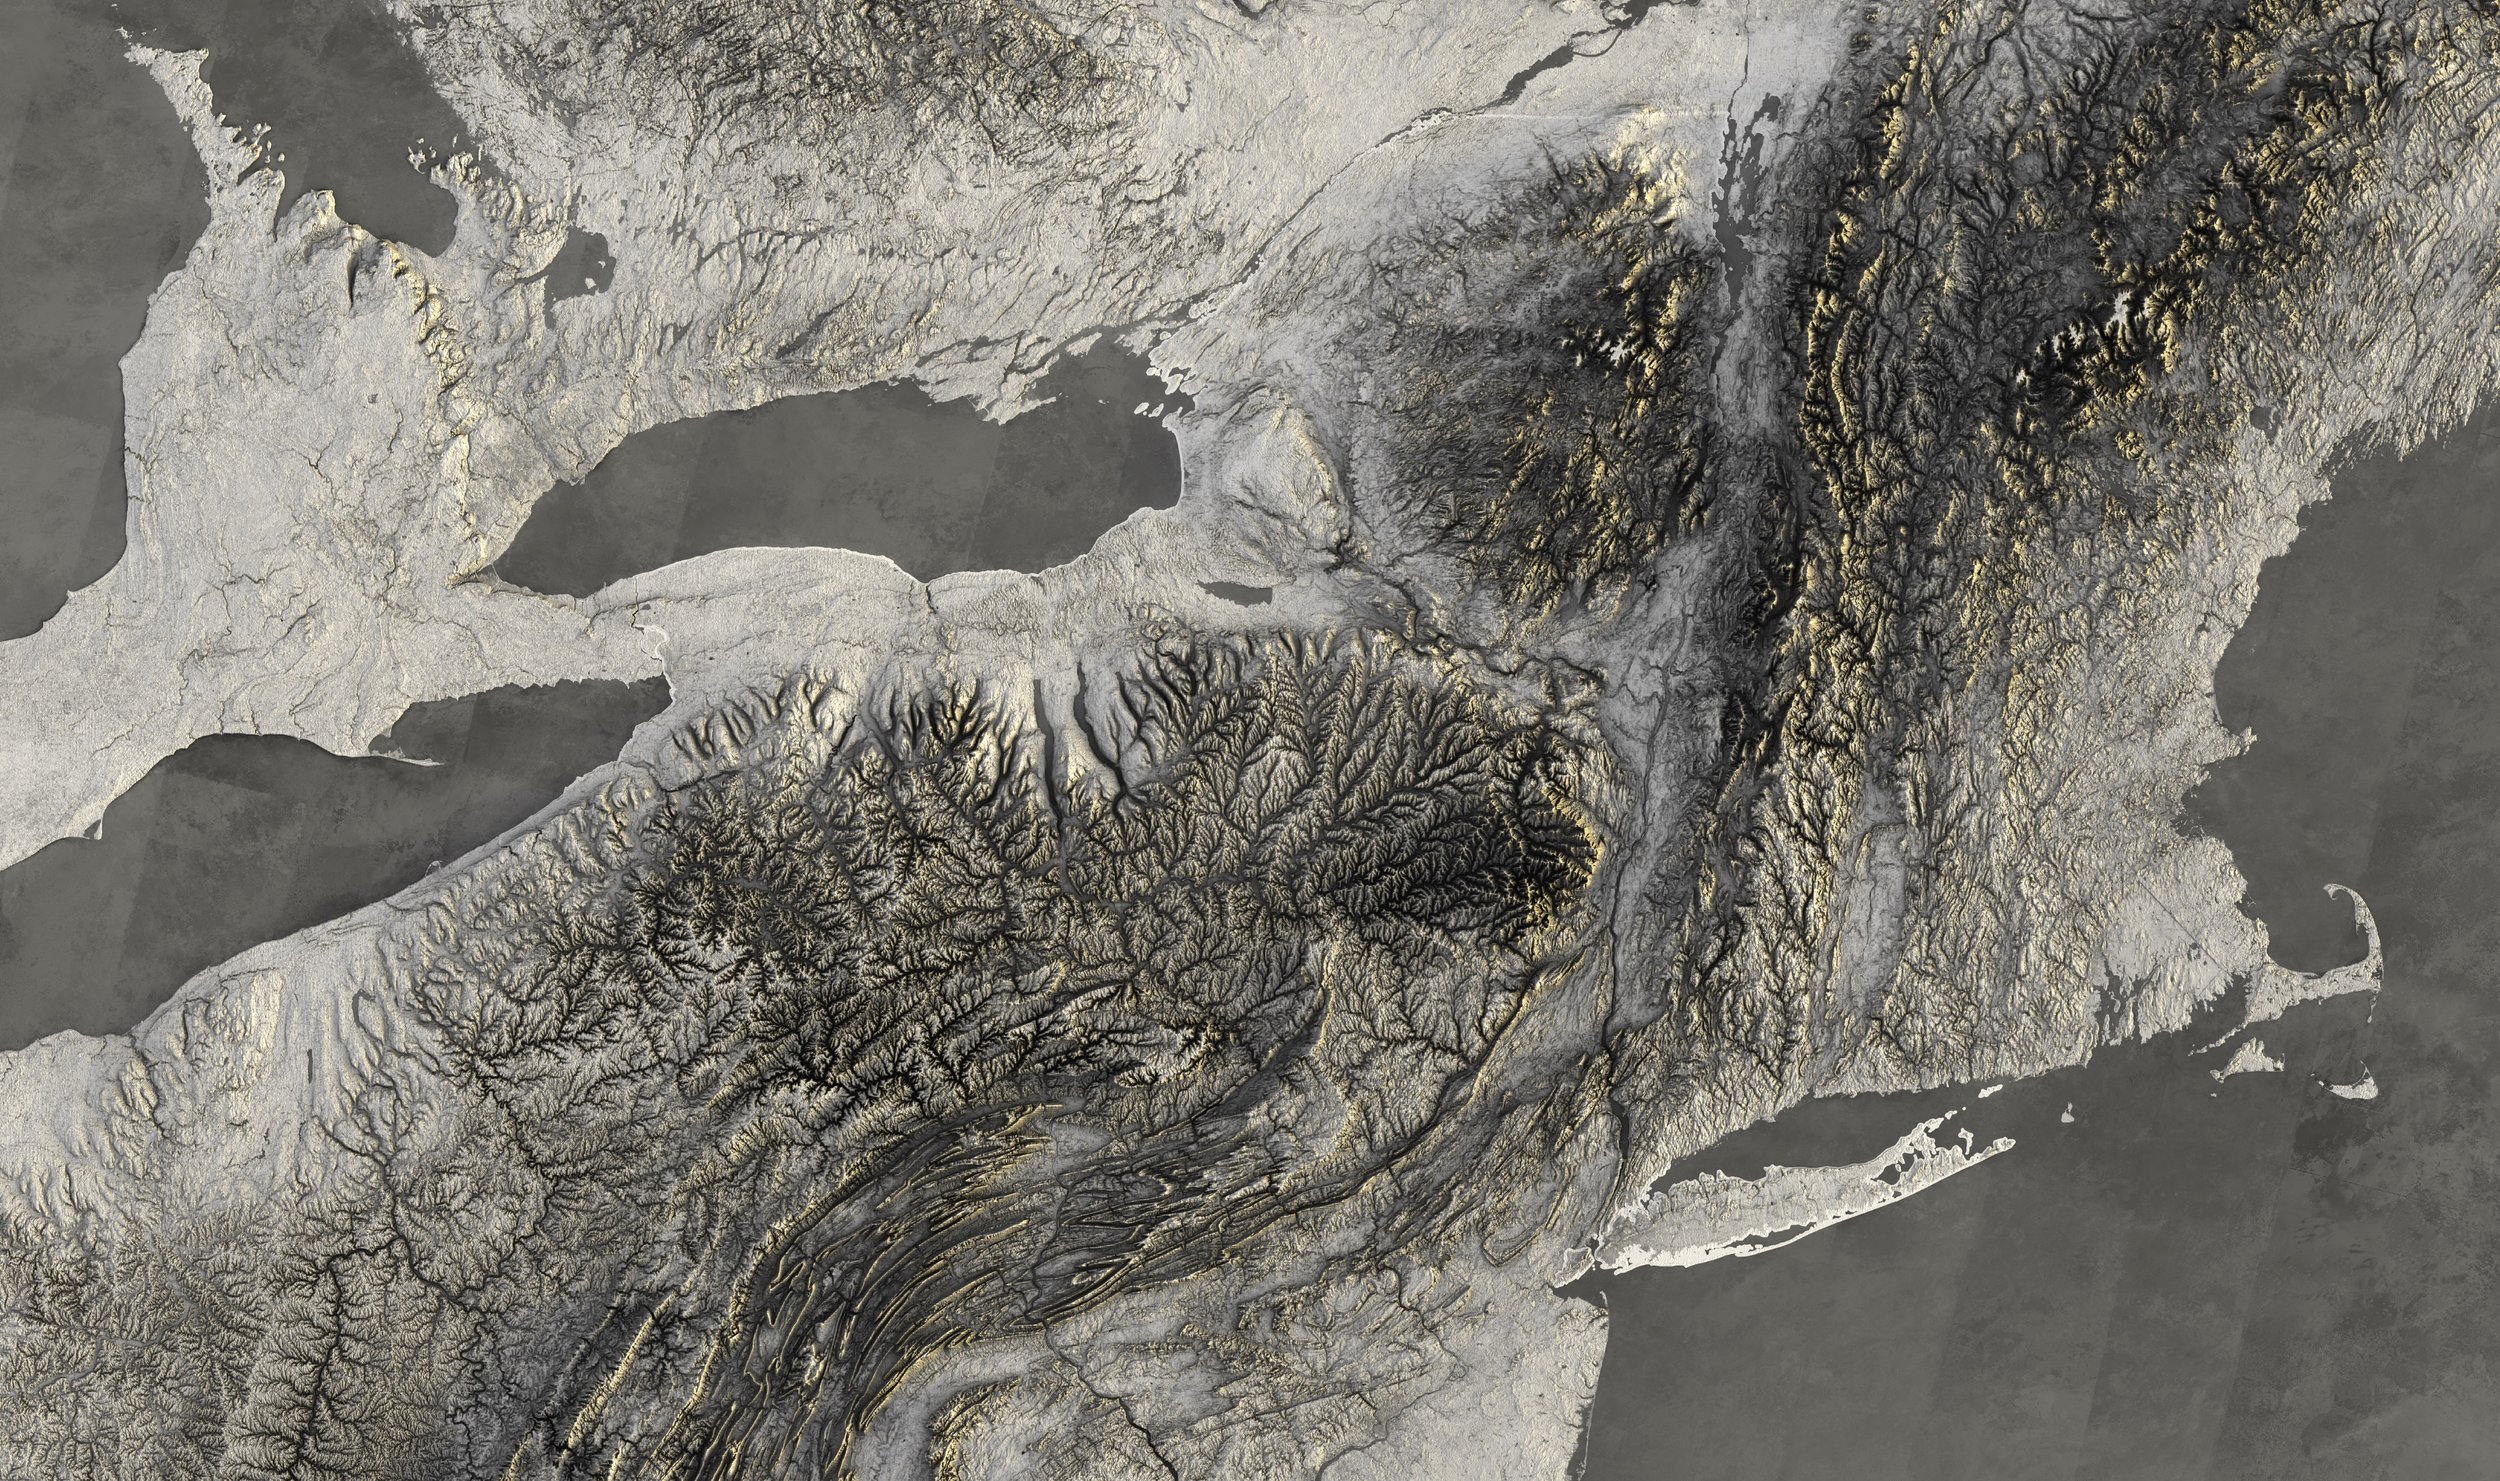
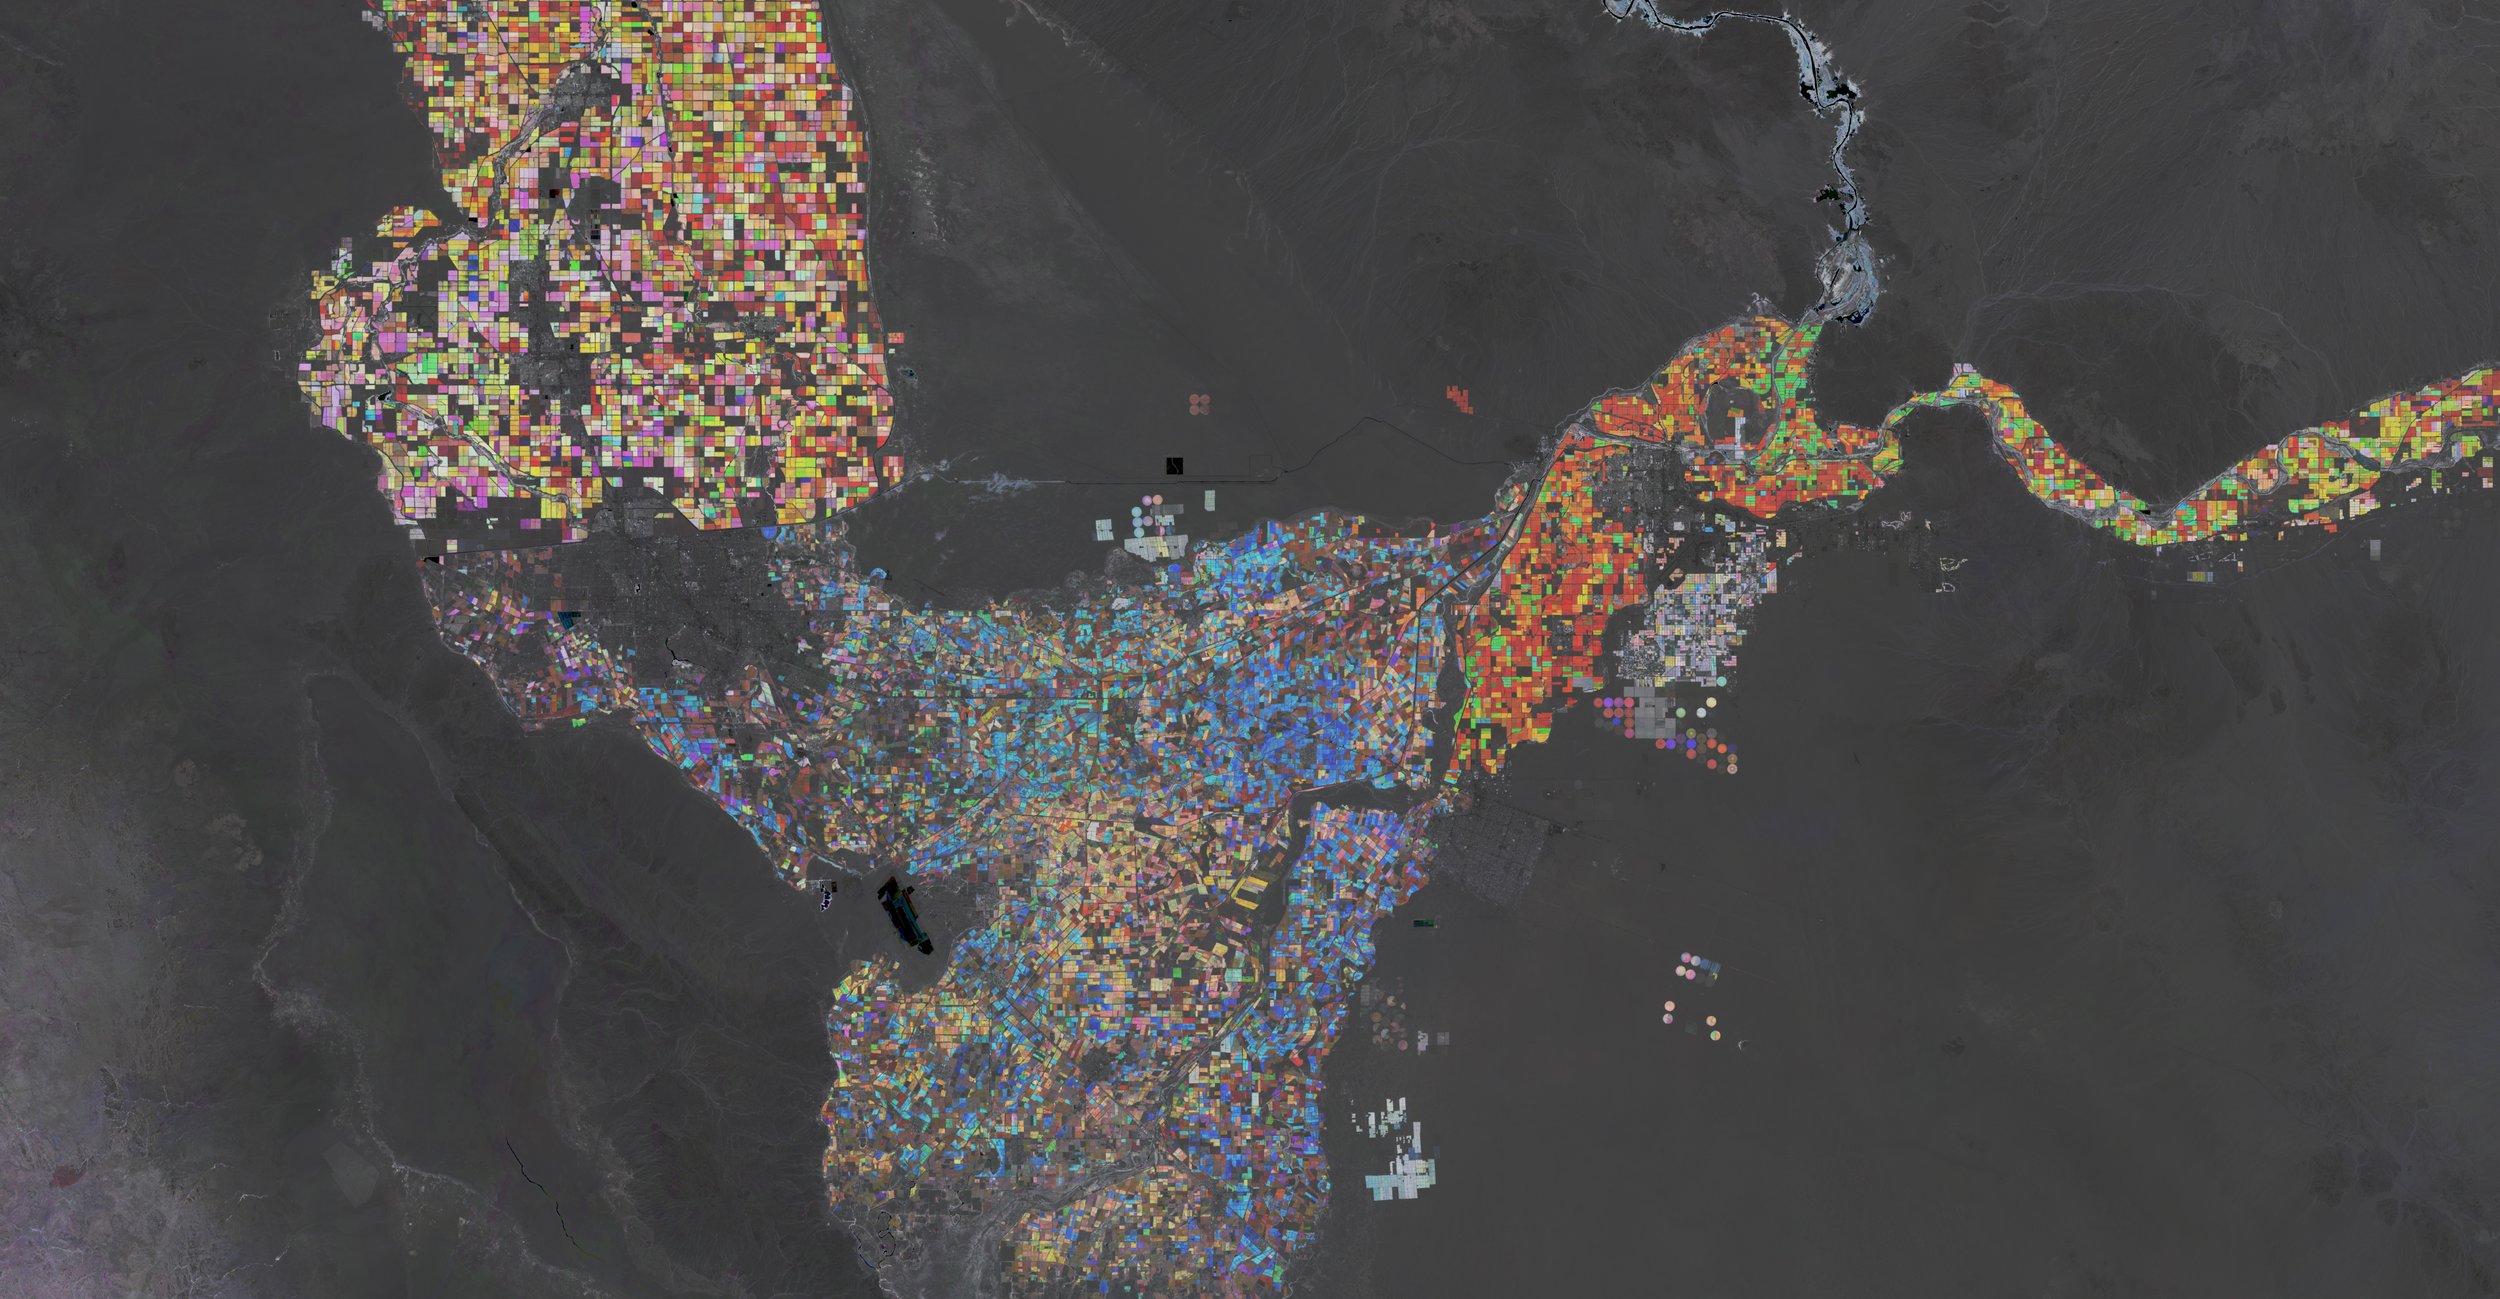
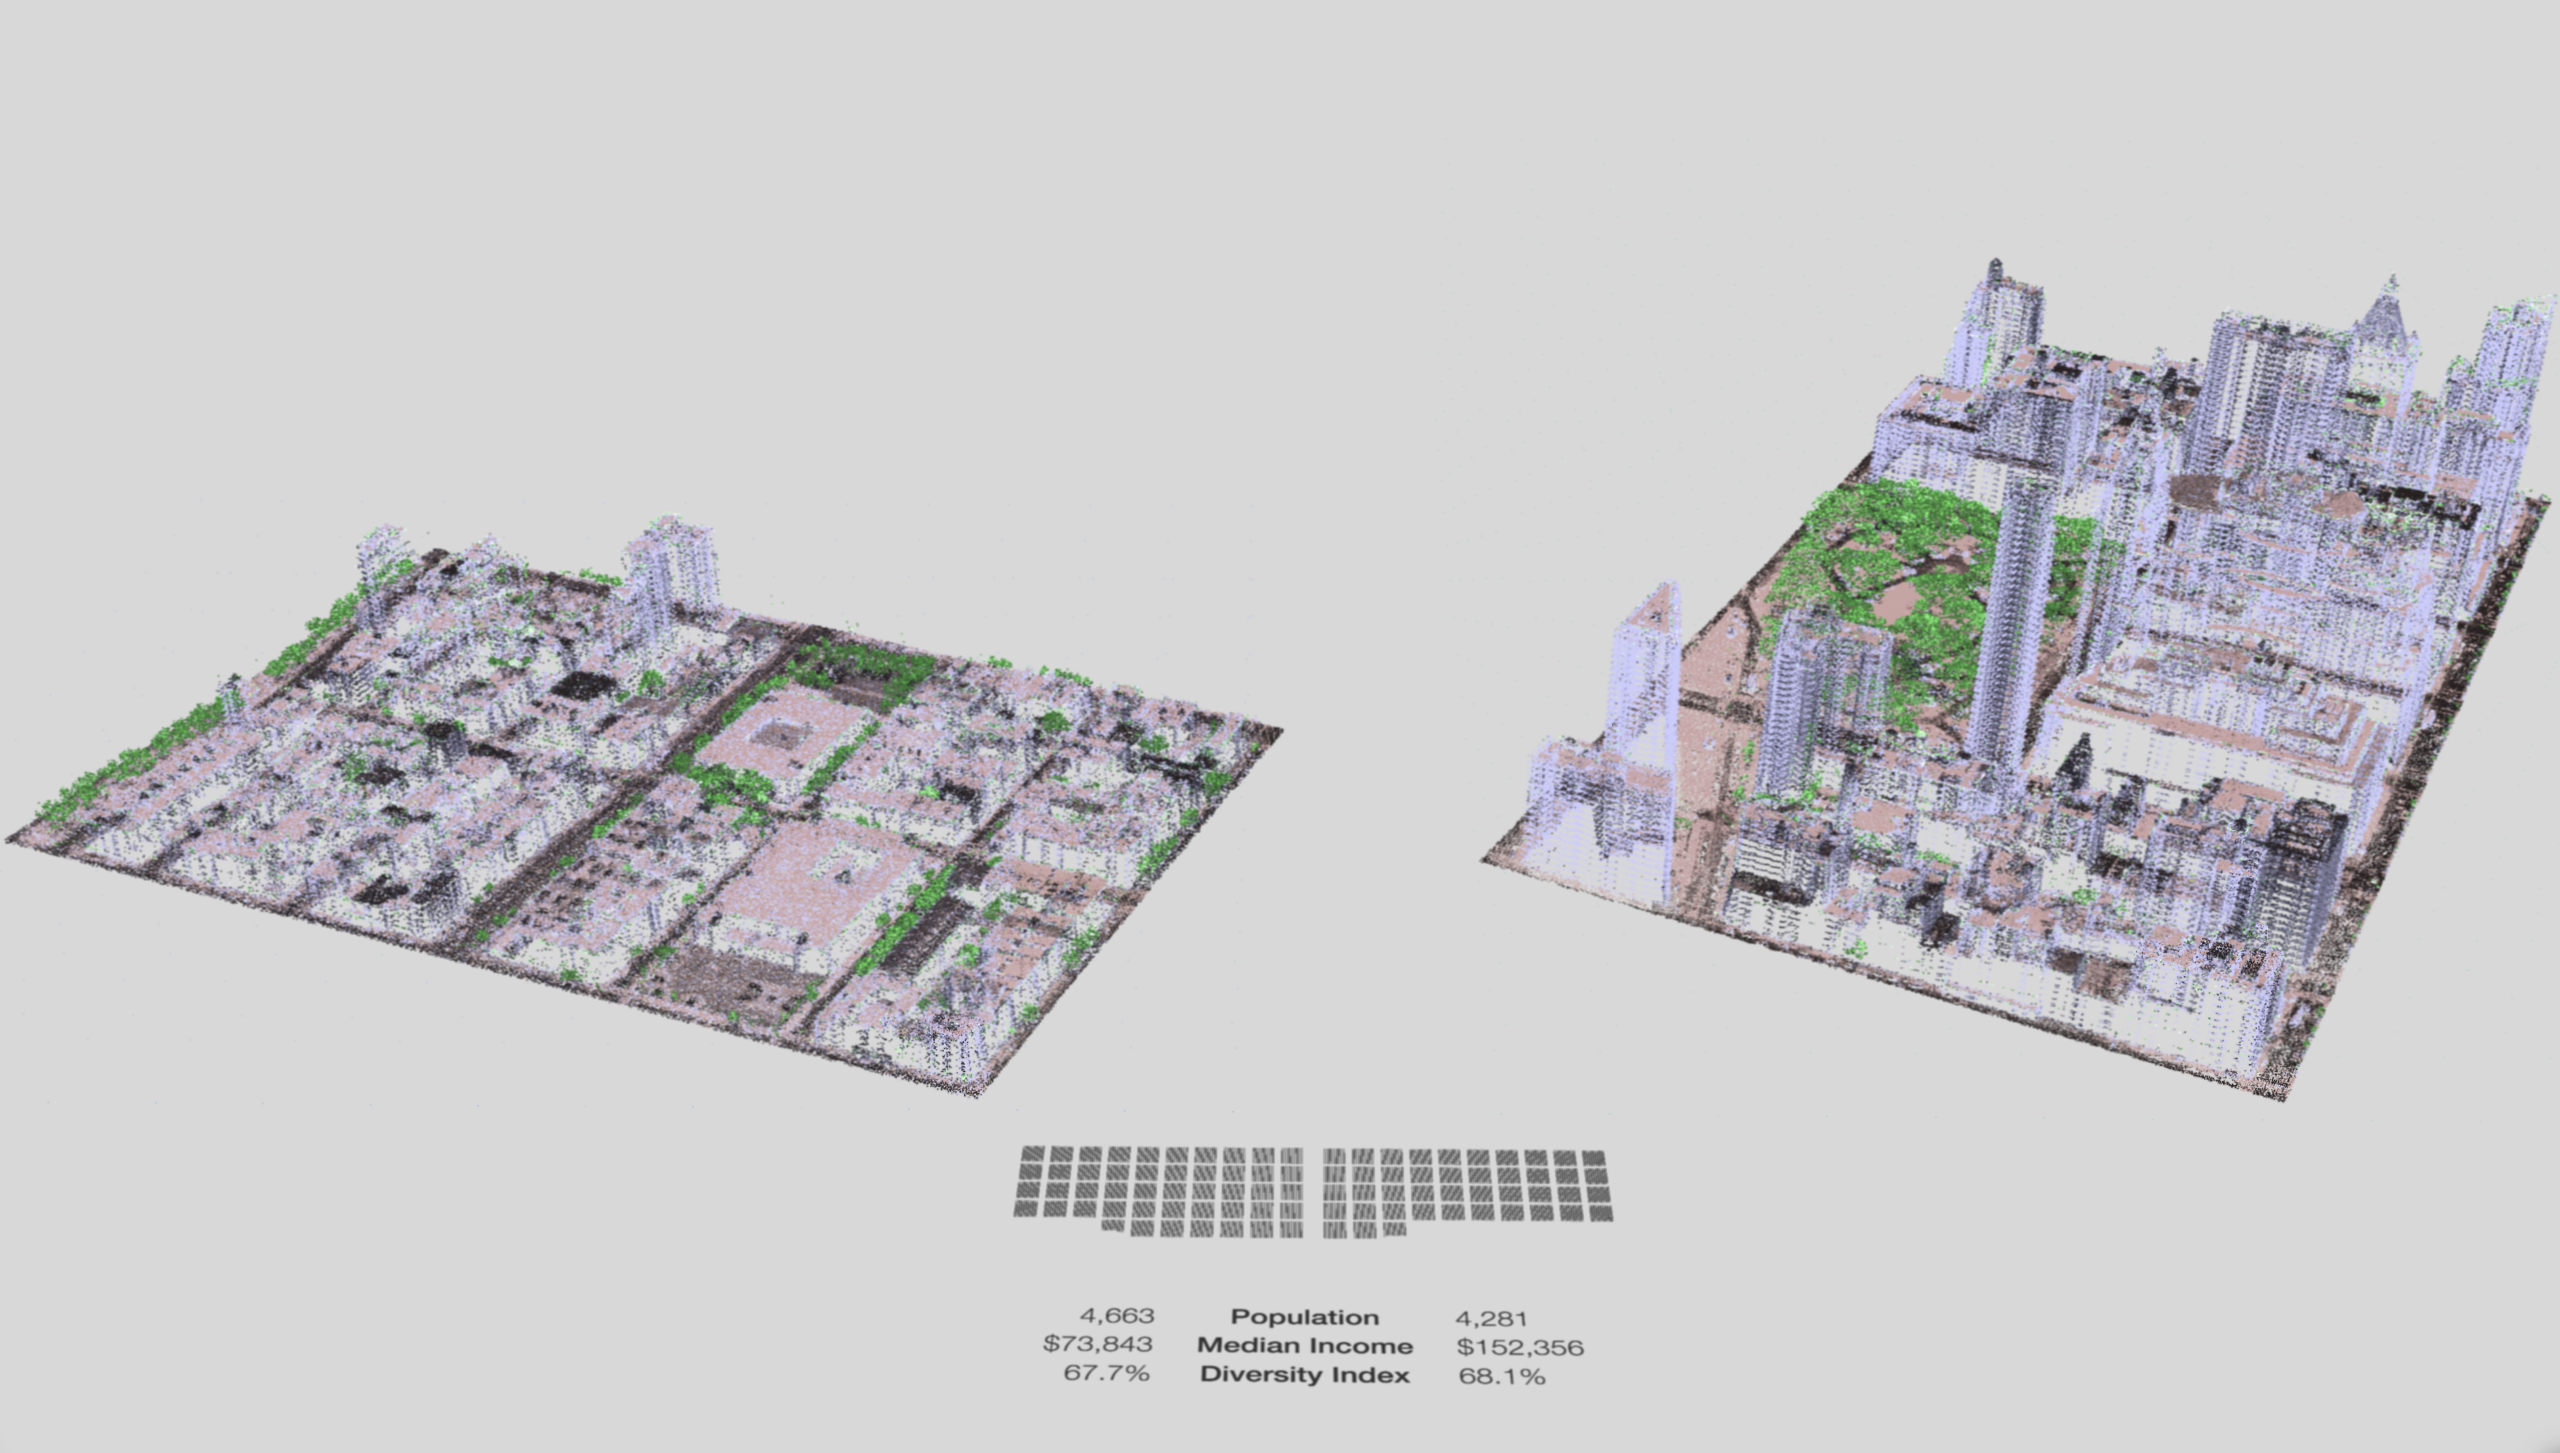
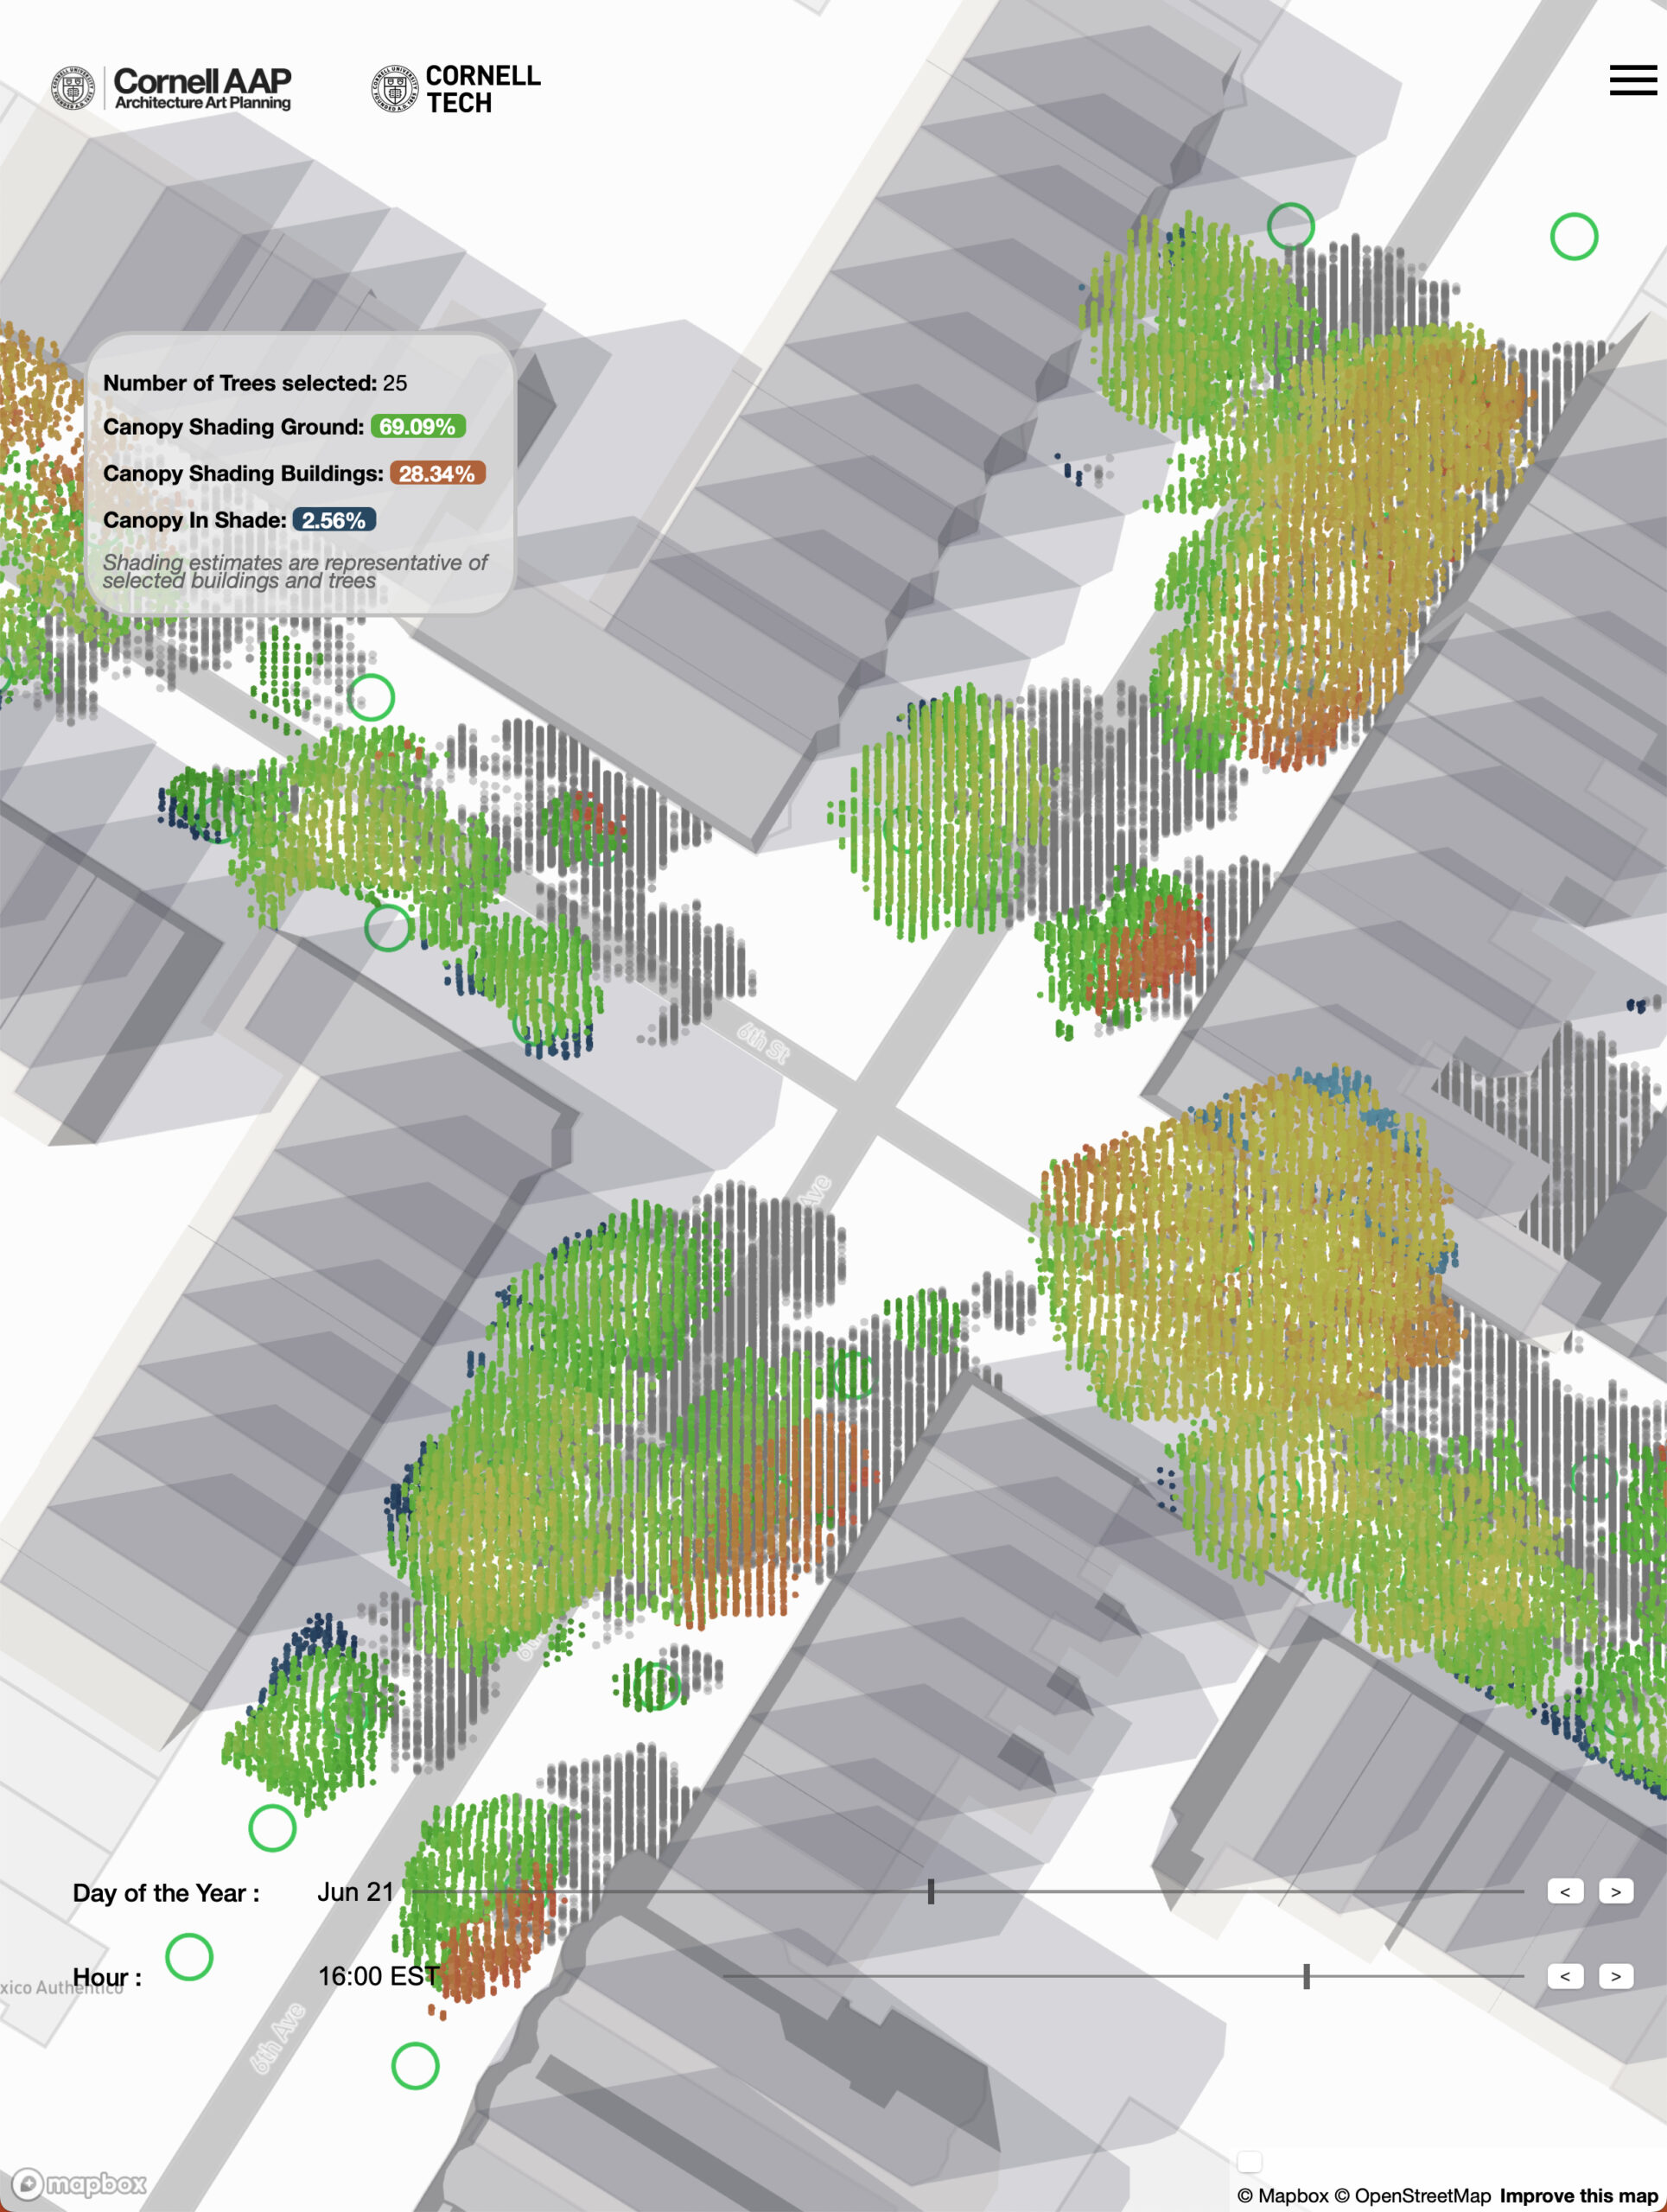
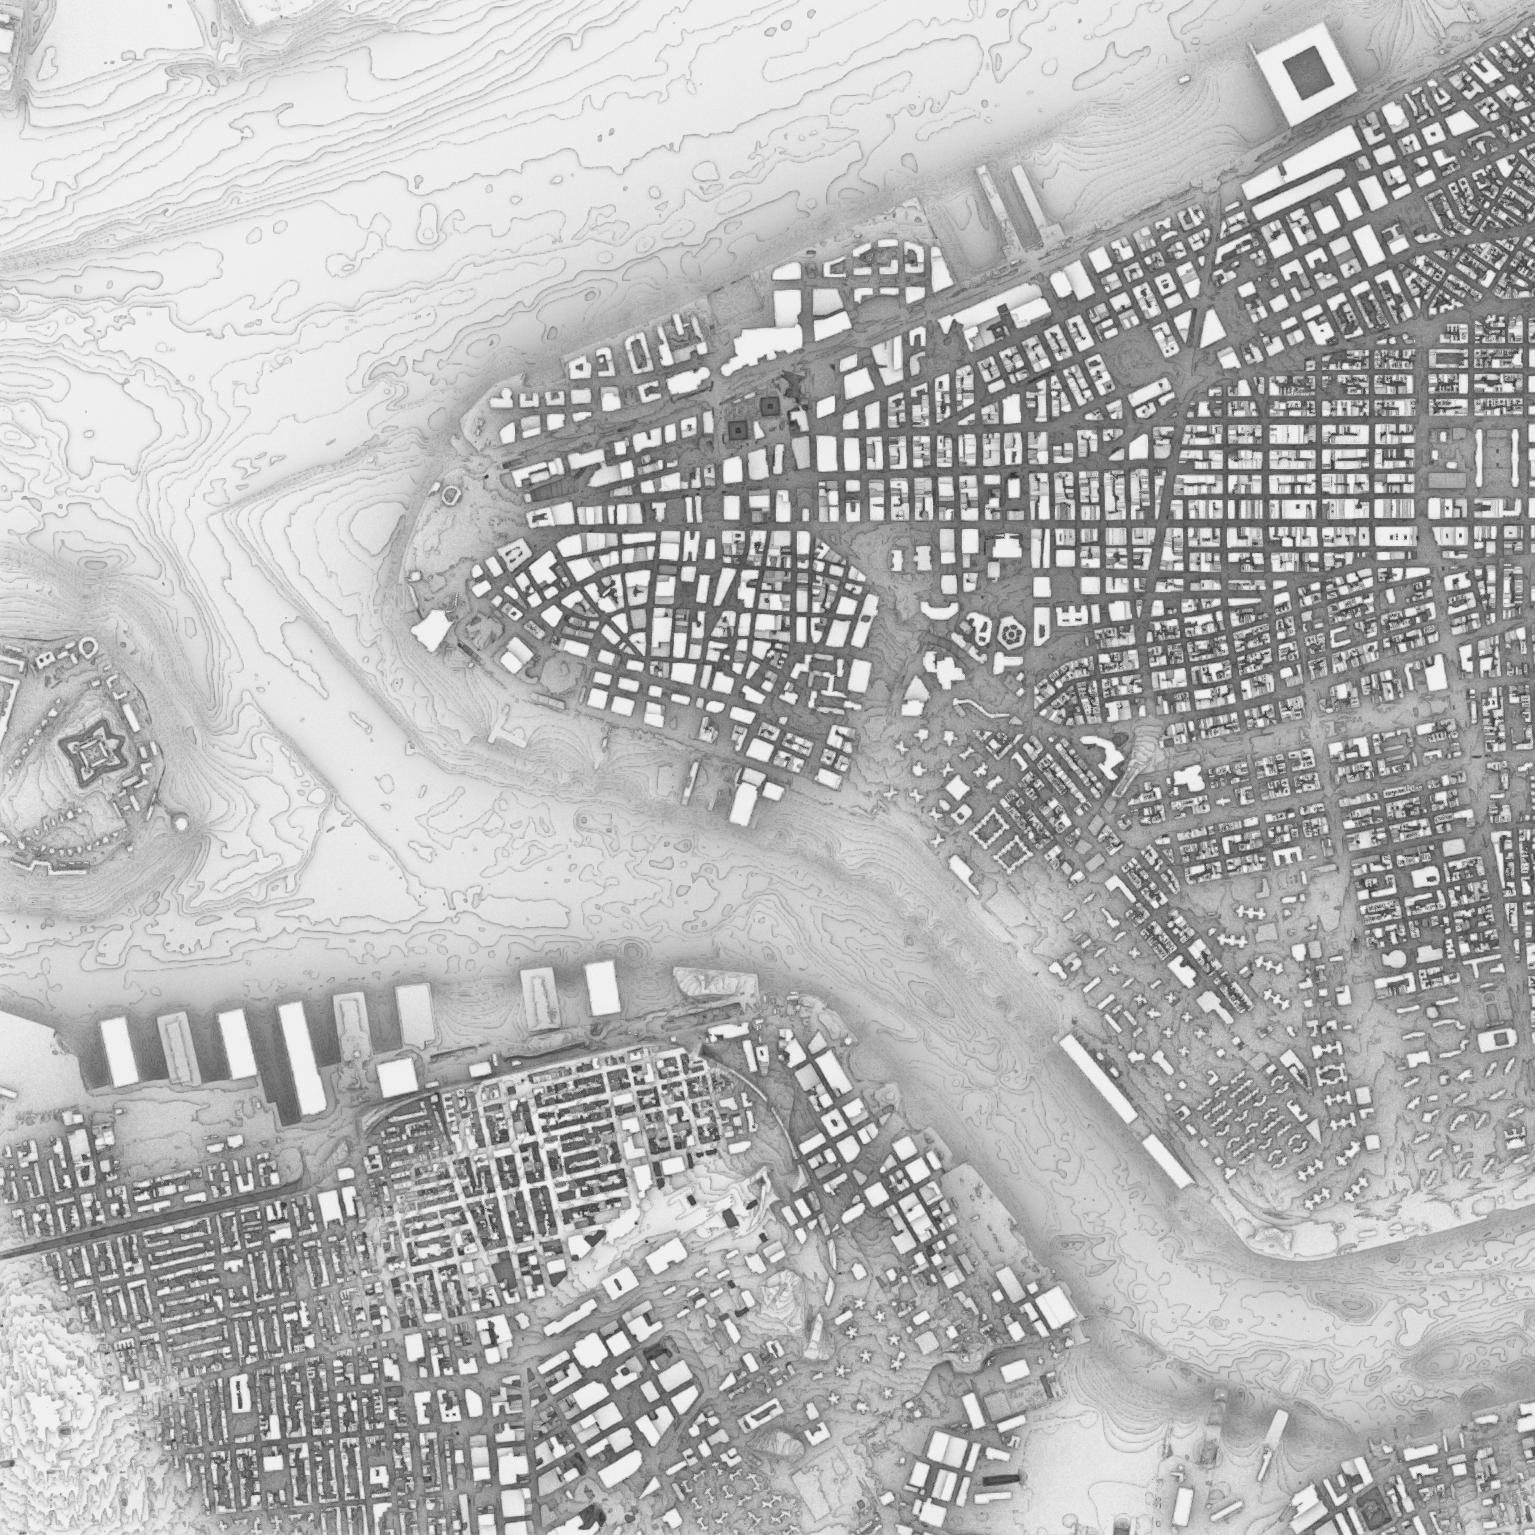
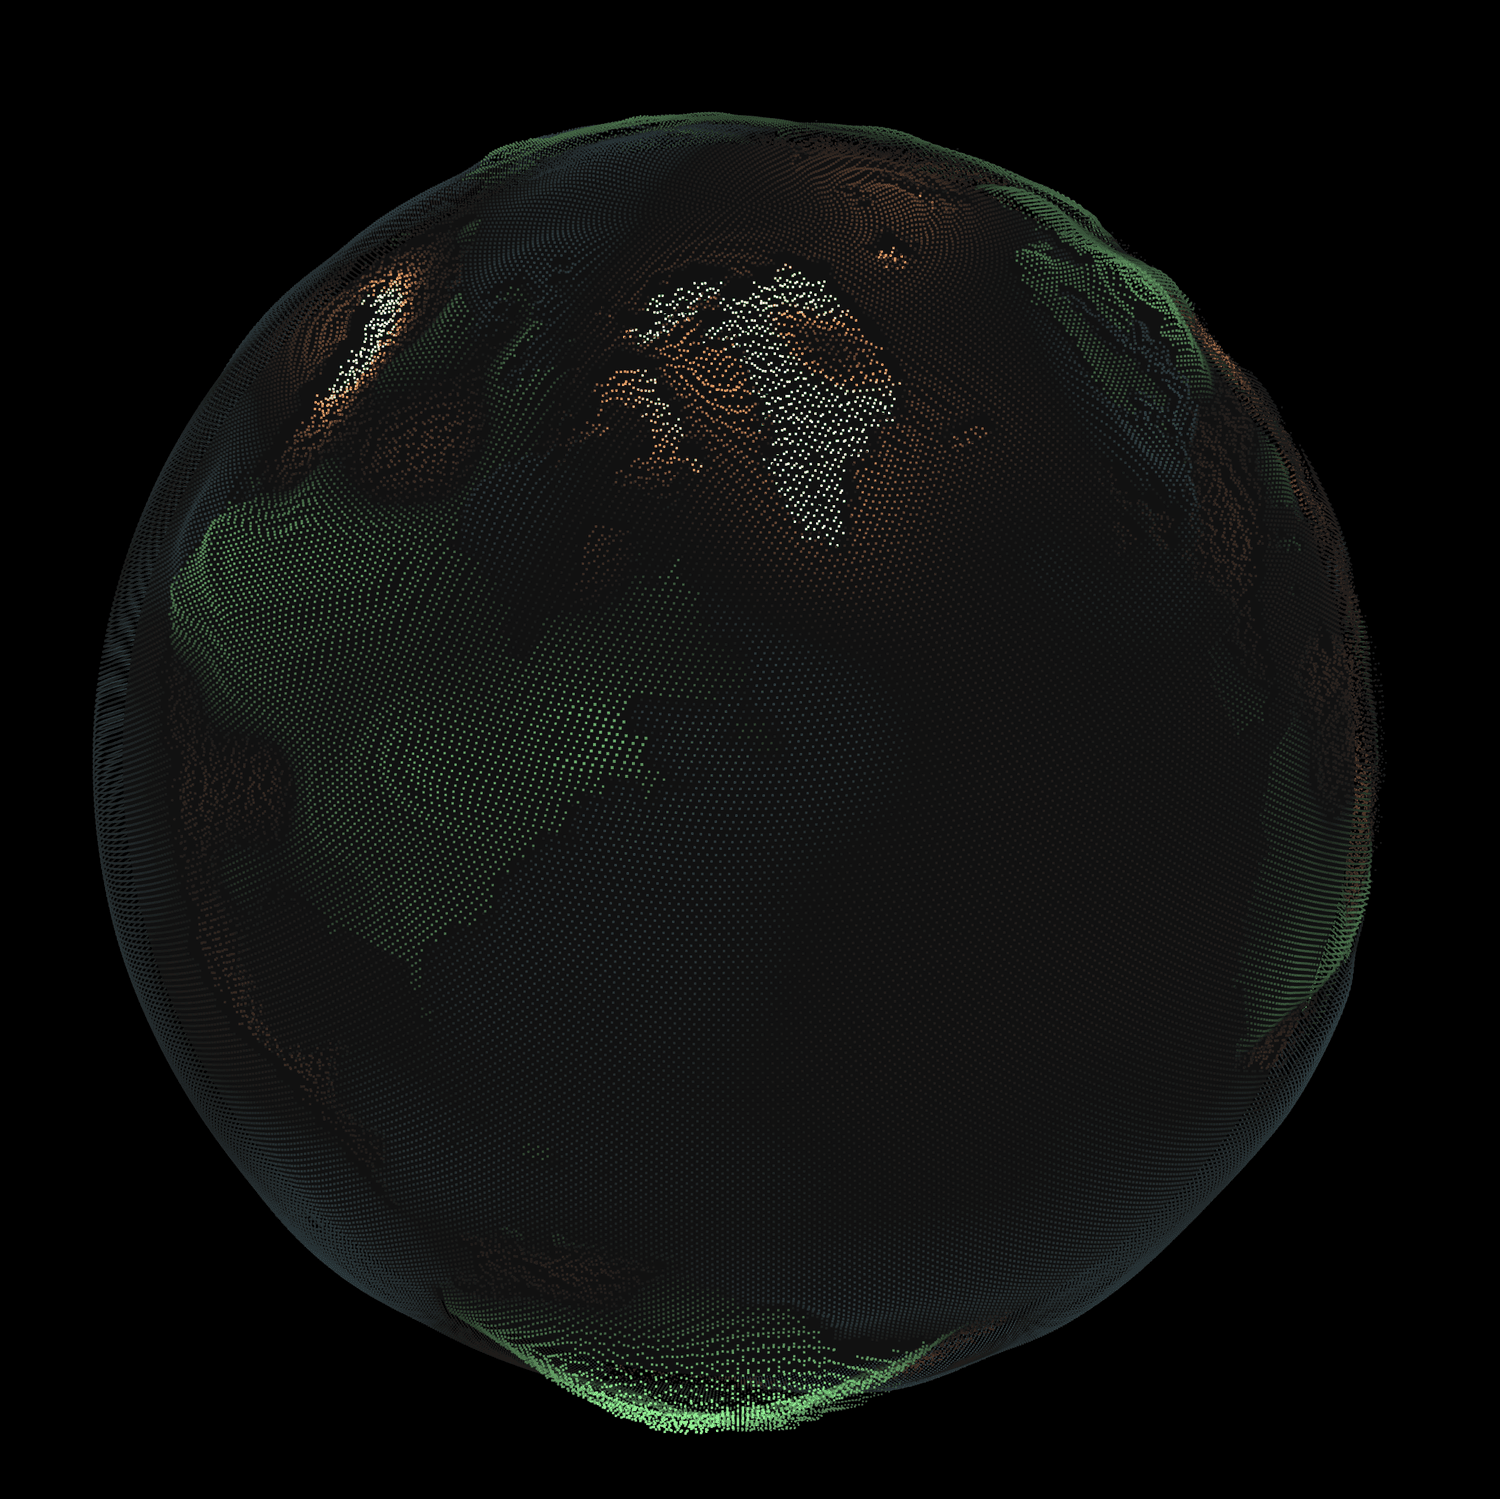
Joe Ferdinando is a design technologist who focuses on data visualization, particularly of large spatial datasets. His work explores how remote sensing mediates representation and can be leveraged and joined with enriching ground truth or stories for social good. Ferdinando is an associate director for the Design Across Scales Lab at Cornell AAP and the Director of Product for Ursa Space Systems. He is a veteran of the US Coast Guard and holds a Masters of GIS from Penn State, M.S. in Earth Systems Science from George Mason University, and an M.Eng. in Computer Science from Cornell University.

Academic Research Areas
- Cities
- Digital media
- Installation art
- Technology and art
- Visual representation